Scientific Paper Results Section Feedback: How to Audit Your Draft for Transparency and Rigor


Your scientific paper results section should report findings clearly and objectively, but drafts often slip into avoidable problems that trigger results section feedback in peer review.
Common issues include “interpretation creep” (mixing interpretation into reporting), weak integration of figures and tables (including unclear figure captions), and incomplete reporting statistical results, especially missing effect estimates, confidence intervals, and exact p-values needed for reproducibility.
In this guide, you will learn what rigorous Results section feedback looks like, which checks are most likely to prevent avoidable peer review delays, and a step-by-step workflow you can use, with thesify’s section-level feedback as an optional academic writing audit, to make your Results section clearer, more transparent, and publication-ready.

You will learn how to:
Separate observation from interpretation
Integrate tables and figures without repeating them in prose
Meet expectations for reporting statistical results (effect estimates, confidence intervals, and exact p-values).
Why the Scientific Paper Results Section Is Hard to Self-Edit
Writing a strong scientific paper results section requires keeping observation separate from interpretation. Because you already know what your findings mean, Results language often drifts into explanations that belong in your Discussion, a pattern commonly called “interpretation creep”.
In a manuscript, the Results section demands strict neutrality; you must function as a narrator of facts, not an advocate for a theory. Self-editing this is cognitively difficult because it requires you to temporarily "unlearn" your conclusions and view the raw evidence with fresh eyes. Failing to separate these elements risks biasing the reader before they have evaluated the full dataset, a structural flaw that frequently leads to rejection or major revision requests during peer review.
How to Audit Your Scientific Paper Results Section
If you want results section feedback before submission, a section-level audit can help you spot common reporting problems early.
In thesify, upload your manuscript and select the “Scientific Paper” document type.
The system automatically identifies your distinct sections—Introduction, Methods, Results, and Discussion (IMRaD)—and generates a tailored (downloadable) feedback report for each one.
Then open Results feedback to generate a section-specific academic writing audit.
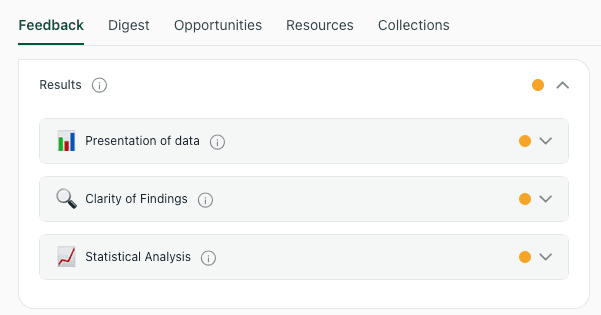
The thesify results audit evaluates your draft across key academic dimensions, including data presentation, clarity of findings, and statistical rigor.
When you open the results section feedback, thesify assesses your work against a specific rubric designed to catch the clarity and reproducibility issues that peer reviewers most often flag. Understanding these dimensions can help you write a better draft from the start.
Improving the Presentation of Data in Your Results Section
Data presentation determines whether readers can follow your analyses and identify the main findings quickly within your Results section.
In thesify, Presentation of Feedback for your Result Section reviews:
Clarity & Structure
Visuals Appropriateness
Integration & Reporting.
The feedback rubric breaks down data presentation into clarity, visuals, and integration to ensure your narrative flow meets publication standards.
Here is exactly what the tool checks for in each category.
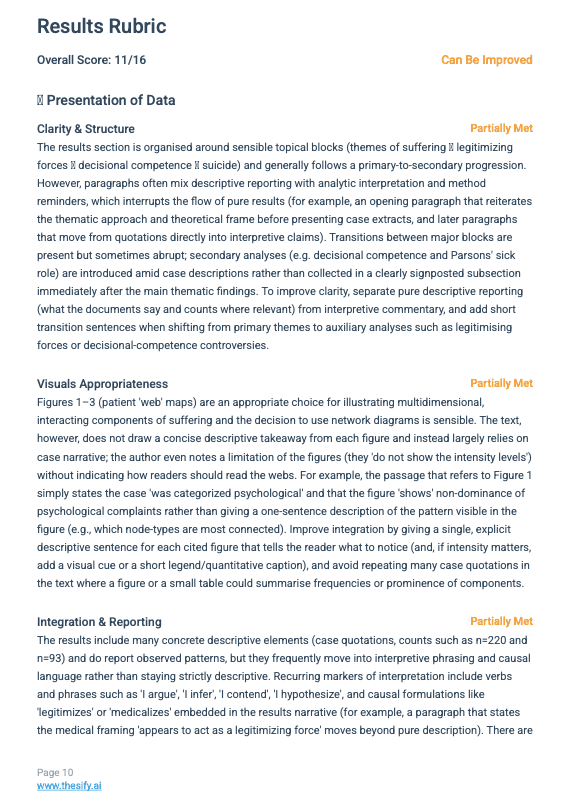
Clarity & Structure
This component evaluates the organizational logic of your narrative. Peer reviewers expect a specific "story arc" in the results—typically moving from sample characteristics to primary outcomes, and finally to secondary or subgroup analyses.
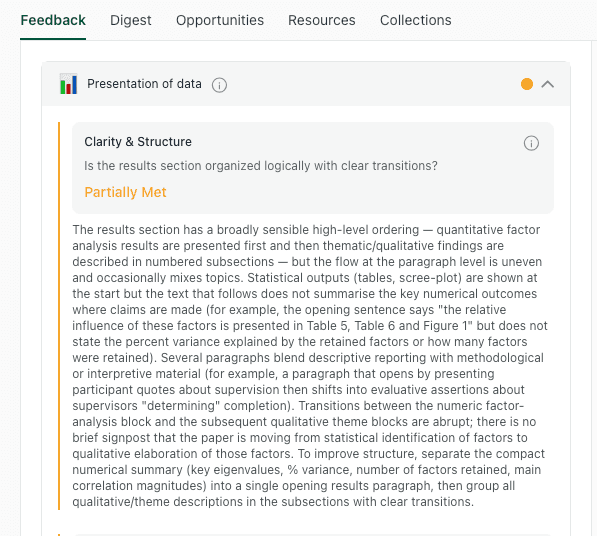
The audit checks for logical sequencing and paragraph coherence, flagging instances where topics are mixed or transitions are abrupt.
thesify audits your draft for:
Logical Sequencing: thesify checks if your paragraphs follow a sensible progression. For example, are you presenting study characteristics (demographics, sample size) before diving into complex experimental outcomes? The feedback will flag if you jump abruptly between topics without clear transitions.
Paragraph Coherence: Does each paragraph stick to one topic? A common error is mixing methodological descriptions (which belong in Methods) or theoretical background (which belongs in the Introduction) into your outcome reporting. thesify identifies these "methodological leaks" so you can keep your results focused purely on outcomes.
Structural Separation: thesify explicitly checks if you have separated descriptive reporting (what the data says) from interpretive commentary (what the data means). If your paragraphs blur the line between fact and opinion, thesify will suggest separating them to improve readability.
Visuals Appropriateness
Figures and tables are essential for condensing data, but they must be designed for immediate intelligibility. thesify assesses whether your chosen visuals are appropriate for the data type and if they are legible at publication scale.
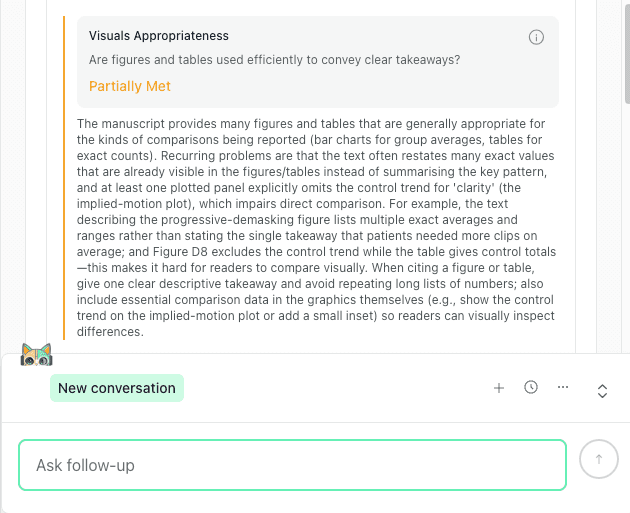
Detailed feedback helps identify "orphaned visuals" that lack clear textual takeaways or essential comparison data.
The feedback scans for:
Design and Legibility:
Are your figures cluttered?
Do they lack essential elements like defined axes, legends, or error bars?
thesify flags issues like insufficient color contrast, cluttered layouts, or missing units that hinder quick interpretation.
Choice of Visual:
Is your visual format (e.g., bar chart vs. line graph) appropriate for the comparison being made?
thesify checks if you are using a visual to display data that could be more simply stated in the text, or vice-versa.
Completeness of Captions:
thesify confirms if your figure captions act as standalone guides.
Do they define abbreviations?
Do they explain what the error bars represent?
The feedback will prompt you to expand captions so a reader skimming the figures can understand them without hunting through the text.
Integration & Reporting
Every table and figure should be introduced in the text with a clear takeaway. This check flags “orphaned” visuals that appear without an in-text reference, a brief interpretation of what the reader should notice, or a clear link to the surrounding Results narrative.
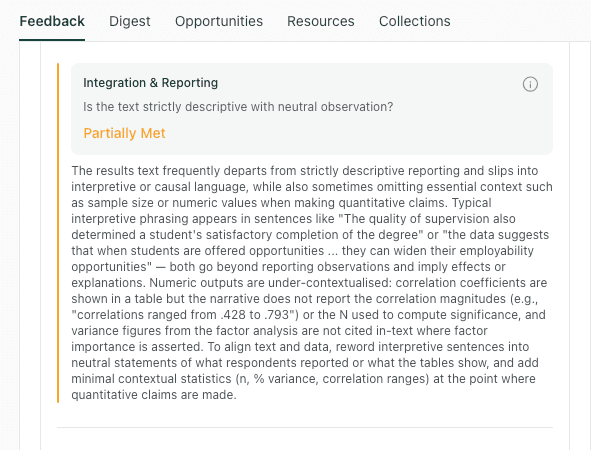
This check ensures your narrative supports your data displays without simply repeating the numbers, and flags "interpretation creep" where causal language slips in.
thesify checks for:
The "Data Dump" Error:
A frequent mistake is restating every single number from a table in the body text.
thesify flags this redundancy and suggests using the text to highlight only the main pattern or outlier, referencing the table for the details.
Takeaway Sentences:
Does every figure have a corresponding sentence in the text that tells the reader what pattern to look for?
The feedback specifically identifies instances where a figure is cited but the text fails to draw a concise descriptive takeaway.
Contextual Reporting:
thesify ensures that outcome statements are not vague. If you mention a "significant difference," the tool checks if you have provided the necessary context (e.g., direction and magnitude) rather than just a p-value.
It also flags "interpretive phrasing" (e.g., "interestingly," "demonstrates") that creeps into descriptive sentences.
Beyond the general results audit, thesify also provides dedicated feedback on the integration of figures and tables, specifically checking if every visual is explicitly referenced and if the narrative guides the reader to the key takeaways.
thesify specifically checks if tables are explicitly referenced in the text and if the narrative guides the reader to the key takeaways.
Results Section Feedback: What Reviewers Mean by “Clarity”
Clarity in a scientific paper Results section means readers can identify who was measured, what was compared, and what the result was on a single pass. Results section feedback in thesify focuses on wording precision and paragraph flow to reduce ambiguous phrasing and improve readability.
Here is how thesify helps you tighten your prose and professionalize your reporting of research results.
Specific suggestions guide you to standardize reporting structure and separate interpretive text to improve the clarity of your findings
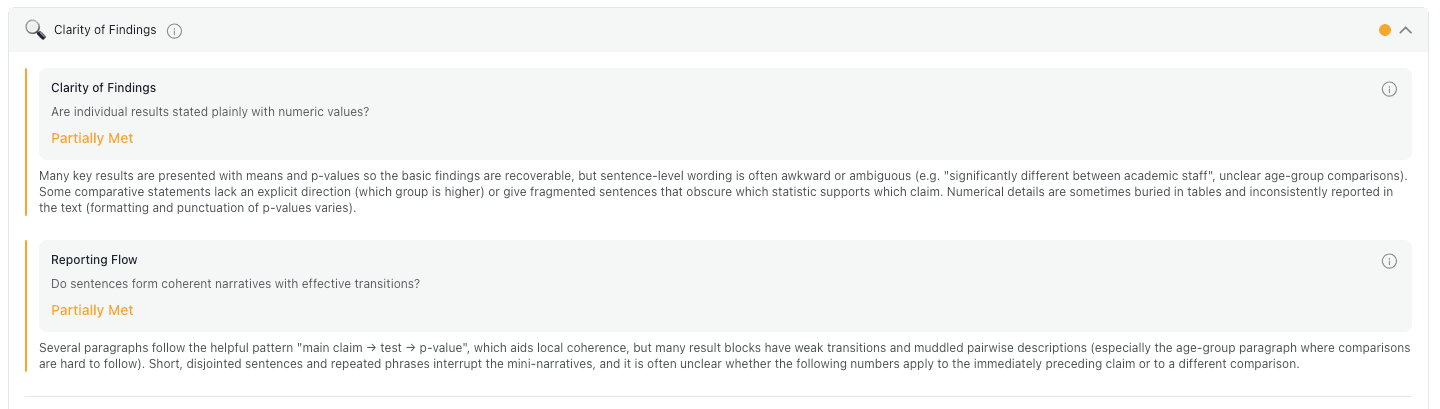
Clarity of Findings
This check targets vague language that weakens Results reporting, such as “many,” “some,” or undefined group labels. It prompts you to replace imprecise phrasing with specific numbers, percentages, and clearly named groups.
The feedback engine scans for vague quantifiers (like "many" or "some") and checks if your sentences form a coherent narrative flow.
Specifically, thesify checks for:
Precision of Language: It identifies vague terms like "many," "few," "some," or "consistent decreases" and suggests replacing them with specific counts (n), percentages, or effect sizes to ensure magnitudes are clear to the reader.
Jargon Definitions: It ensures that technical terms (e.g., specific "suffering states" or "IPV") are clearly defined upon first use and used consistently throughout the narrative so that the text remains accessible.
Explicit Statements: It checks if your sentences make the reported observation explicit before offering examples. This ensures the reader knows exactly what fact is being presented before diving into the details.
Reporting Flow
Even when sentences are clear, Results can still feel disorganized at the paragraph level. This check looks for consistent movement from a finding to its supporting data, and it flags abrupt topic shifts where multiple outcomes or analyses are mixed in one paragraph.
thesify evaluates:
Local Signposting: thesify checks for transitional phrases (e.g., "In sum," "We note," "Conversely") that guide your reader through shifts in topic or analysis, preventing abrupt jumps between ideas.
Paragraph Logic: thesify assesses whether your paragraphs build a coherent "mini-narrative."
For example: does a paragraph start with a clear summary sentence of the main finding before diving into the detailed numbers and p-values?
Sentence Continuity: thesify flags instances where table insertions or awkward transitions break the flow of reading, producing chopped or incomplete thoughts that hinder comprehension.
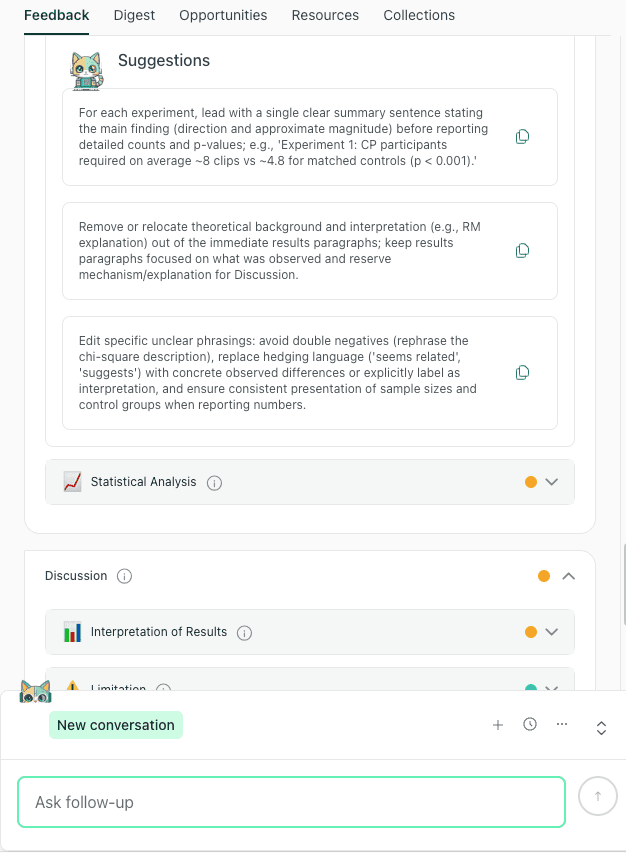
Actionable Suggestions for Improvement
The report pairs each issue with edit-ready suggestions you can apply directly in the Results section. Recommendations focus on common reviewer concerns, including unclear comparisons, missing figure or table references, and interpretation creeping into reporting.
thesify identifies specific sentences where interpretation creeps into results and suggests moving them to the Discussion or Methods to improve clarity.
Typical suggestions you might receive include:
"Standardize quantitative reporting": thesify may advise you to always include the n and percentage whenever a count is mentioned, ensuring consistency across your manuscript.
"Lead with the takeaway": For complex experiments, thesify often suggests structuring paragraphs to lead with a single clear summary sentence stating the main finding (direction and magnitude) before listing the statistical details.
"Separate fact from interpretation": If your reporting flow is interrupted by theoretical explanations, thesify will explicitly prompt you to move those interpretive sentences to a distinct paragraph or the Discussion section to improve reader uptake.
How to Report Statistical Results in the Results Section
In quantitative papers, reporting statistical results is one of the highest-scrutiny parts of the scientific paper results section. Reviewers often flag “black box” reporting where an effect is described as significant without enough detail to judge magnitude, uncertainty, and reproducibility.
The statistical analysis module breaks down rigor into three key checks: methods description, test appropriateness, and reporting transparency.
thesify audits this by evaluating Methods Description, Appropriateness, and Reporting Transparency, assigning a score of "Met," "Partially Met," or "Not Met" to helps you gauge your readiness.
Here is how thesify helps you ensure your numbers are robust and reproducible.
The feedback module evaluates whether your statistical methods are clearly described (Methods Description) and appropriate for your study design (Appropriateness
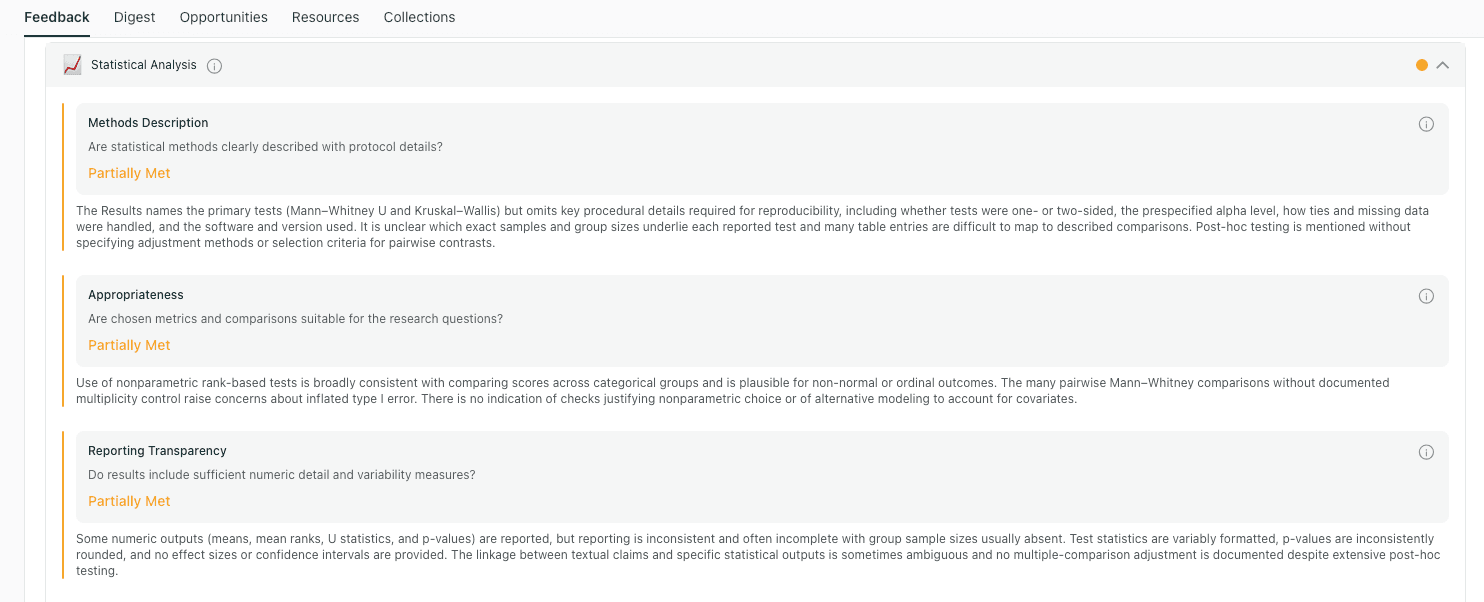
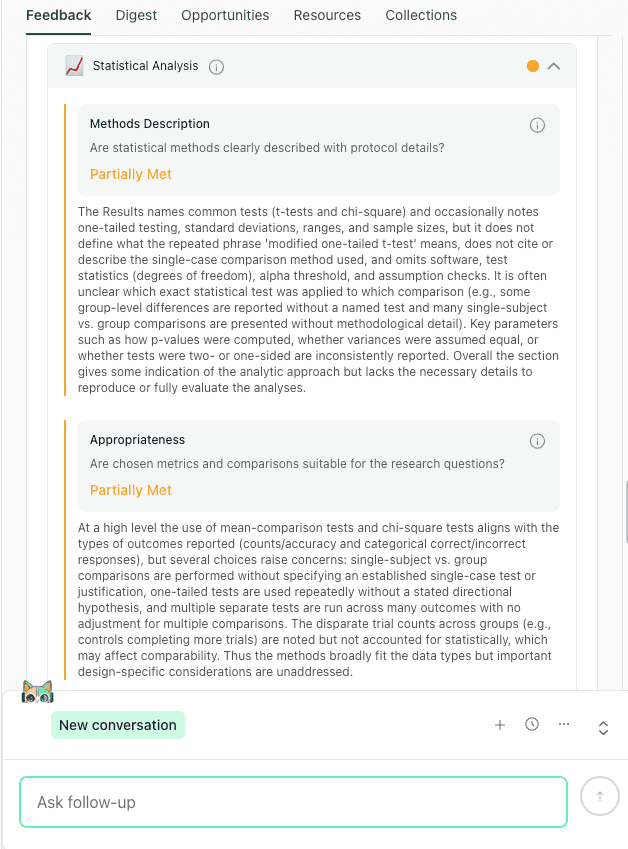
Methods Description
In your Results section, statistical values need to be tied to the analysis that produced them. This check flags statements that report p-values or differences without naming the test or model, the comparison being made, and the relevant sample size.
The feedback evaluates:
Test Identification: Did you name the specific test (e.g., "modified one-tailed t-test" or "Chi-square") applied to each comparison?
Parameter details: Did you specify key parameters, such as whether variances were assumed equal or if a test was one- or two-sided?
Software citations: It checks if you have listed the statistical software and version used, which is critical for reproducibility.
Appropriateness
This dimension assesses whether the statistical tests you chose actually fit the data you are presenting. thesify looks for alignment between your study design and your analytic choices.
The feedback checks for:
Data Type Alignment: Does the test match the outcome type (e.g., using mean-comparison tests for continuous data vs. Chi-square for categorical counts)?
Design Considerations: It flags if you have performed multiple comparisons without adjusting for them, or if you are comparing groups with disparate trial counts without accounting for that imbalance.
Justification: If you use non-standard tests (like single-subject vs. group comparisons), thesify checks if you have cited a validated method or provided a justification.
Reporting Transparency
Statistical transparency means reporting enough detail for readers to evaluate both magnitude and uncertainty. This check looks for the core elements expected in reporting statistical results, including effect estimates, confidence intervals, exact p-values, and clear sample sizes or denominators.
thesify audits your draft for:
The Statistical Triplet thesify checks if you reported:
Estimate (mean/count)
Precision (Confidence Interval or Standard Deviation)
Test Statistic (exact p-value and degrees of freedom).
Exact P-values: It prompts you to replace inequalities (e.g., p <.05%) with exact values (e.g., p =.042%) whenever possible to allow readers to assess the strength of the evidence.
Missing Denominators: It flags percentages or counts that lack a denominator, ensuring that readers know exactly how big the sample was for that specific comparison.
Scoring: Met vs. Partially Met
Each Results dimension receives a status score so you can prioritize revisions quickly. Treat “Partially Met” and “Not Met” items as your first-pass edit list before re-running Results feedback.
Met: Indicates that your reporting is complete and transparent (e.g., you consistently named tests and reported exact p-values).
Partially Met: Suggests that while the basics are there, key details are missing (e.g., you reported p-values but omitted Confidence Intervals or software versions).
Not Met: Alerts you to a critical gap, such as making inferential claims without describing the statistical methods at all.
Actionable Suggestions for Improvement
When a dimension is marked “Partially Met” or “Not Met,” the report provides specific fixes you can implement immediately (what to add, what to rewrite, and where clarity breaks down).
Common suggestions include:
"Report the full triplet": For every quantitative outcome, report the effect estimate with its confidence interval, the exact p-value, and the sample size.
"Specify the model": State the statistical test or model used for each result and list key covariates or adjustments (e.g., clustering).
"Define the alpha": Explicitly state the alpha threshold and any methods used to adjust for multiple comparisons.
Results Section Feedback: Common Reporting Pitfalls and Fixes
These pitfalls come up repeatedly in results section feedback and are often straightforward to correct once you know what to look for. Use the examples below to revise your scientific paper results section for clearer reporting and fewer avoidable peer review comments.
1. Interpretation Creep: Mixing Results and Discussion
Interpretation creep happens when Results sentences start explaining why something happened, rather than reporting what happened. This blurs the boundary between evidence (Results) and argument (Discussion), and it often leads to reviewer comments about overclaiming.
The Flag: Feedback noting interpretive framing such as “this suggests,” “I argue,” “appears to,” “is linked to,” or causal language that is not directly supported by the reported analysis.
The Fix: Move explanation, meaning, mechanism, or causal speculation to the Discussion. Keep the Results focused on observable outcomes and the analyses you ran.
Weak: “The low score suggests anxiety.”
Improved: “Participants reported a mean score of 12 (SD = 2), below the clinical threshold.”
2. The Data Dump: Repeating Tables in Prose
Tables exist to hold dense values so your narrative can stay readable. A common Results mistake is copying most of a table into a paragraph, which makes the text harder to scan and obscures the main finding.
The Flag: Feedback indicating redundancy, poor readability, or that the narrative restates values already visible in tables.
The Fix: Use text to report the main trend, the key comparison, or one notable outlier, then point the reader to the table for full detail (for example, “see Table 2 for complete results”).
Weak: “Group A was 3.1, Group B was 3.4, Group C was 3.2…”
Improved: “Scores were highest in Group B and lowest in Group A (Table 2).”
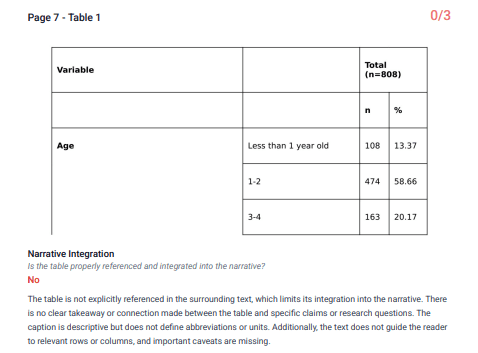
3. Orphaned Visuals: Figures Without a Takeaway
Figures should never stand alone. If a reader has to guess why a figure is included or what pattern matters, the figure is not doing its job in your research paper structure.
The Flag: Feedback noting that a figure is present but not integrated, not referenced in the text, or lacks a clear descriptive takeaway.
The Fix: Introduce every figure in the narrative and state the specific pattern the reader should notice. Then use the caption to clarify what is plotted, units, groups, and any abbreviations.
Template sentence: “As shown in Figure 1, the intervention group reported lower [outcome] than the control group across all time points.”
Workflow: How to Get Results Section Feedback With thesify
Use this workflow to convert results section feedback into a concrete revision sequence before journal submission. It prioritizes reporting completeness first, then readability, so you address the issues most likely to trigger major revision requests.
Step 1: Upload the right draft version
Upload either:
Your full manuscript, if you want feedback aligned with overall research paper structure, or
Only the Results section, if you are focusing on Results-specific issues first
Step 2: Run Results section feedback
In the feedback menu, select Results section feedback (section-level). This targets common Results problems, including clarity, data presentation, and reporting statistical results.
Step 3: Triage issues in the right order
Use the report to prioritise edits, so you fix high-impact problems first.
Fix statistical transparency first
Address any missing reporting elements that affect interpretability and reproducibility, including:
Sample sizes (n) and denominators for percentages
Effect estimates, confidence intervals, and exact p-values
Undefined abbreviations, missing units, or unclear measurement scales
These omissions frequently drive “major revision” requests because reviewers cannot evaluate the findings without them.
Fix data presentation and structure second
Then improve readability and flow:
Check the Presentation of Data score and comments
Split overloaded paragraphs (for example, separating participant characteristics from outcomes)
Add signposting sentences that tell the reader what the next paragraph reports (primary outcomes, secondary outcomes, subgroup analyses)
Step 4: Re-run the Results check after edits
After revising, run Results section feedback again to confirm:
the reporting is still consistent (no new contradictions introduced), and
your edits reduced redundancy, improved figure/table integration, and clarified key findings
Checklist: The Ultimate Scientific Paper Results Audit
Before submission, use this scientific paper Results Section checklist to confirm that your reporting is complete, clear, and aligned with reviewer expectations:
Neutrality: Have you removed all words that imply causality or theory (e.g., "suggests," "explains," "proves")?
Precision: Does every quantitative claim include the n, percentage, and relevant statistical metrics (CIs, exact p-values)?
Integration: Does every Figure and Table have a reference in the text, accompanied by a sentence summarizing its main takeaway?
Separation: Are the study characteristics (demographics, sample size) separated from the experimental outcomes?
Context: Have you provided the necessary denominators for every percentage reported?
Visuals: Do your figure captions clearly explain the data, or are they just titles?
Scientific Paper Results Section FAQs
What should be included in the results section of a scientific paper?
Your Results section should report the outcomes of your analyses in a logical order, supported by tables and figures where needed. For quantitative studies, include sample sizes, effect estimates, confidence intervals, and exact p-values for key comparisons.
How do I separate results from discussion?
In the scientific paper results section, focus on what the data shows, not why it matters. Move explanations, mechanisms, implications, and causal claims to the Discussion, and keep Results language descriptive rather than interpretive.
What is the difference between descriptive and interpretive reporting?
Descriptive reporting states what was observed (values, directions, magnitudes, uncertainty). Interpretive reporting explains meaning or cause (for example, “this suggests” or “this demonstrates”), which is usually better placed in the Discussion.
How do I report statistical significance correctly?
Avoid reporting only “significant” or only p-values. Report the effect estimate with a confidence interval, and give the exact p-value where possible, so the reader can evaluate precision and practical importance.
Can I use a tool to check my research paper results?
Yes. A results section feedback tool can help you spot interpretation creep, missing denominators or sample sizes, weak figure and table integration, and gaps in reporting statistical results before submission.
How to Make Your Scientific Paper Results Section Publication-Ready
A publication-ready scientific paper results section lets reviewers verify what you did and what you found without inference. In this post, you learned how to prevent interpretation creep, avoid repeating tables in prose, integrate visuals with clear takeaways, and strengthen reporting statistical results for transparency and reproducibility.
We also outlined what strong reporting statistical results looks like in practice, especially reporting effect estimates with confidence intervals and exact p-values, so your Results are transparent and reproducible.
Finally, you saw a practical editing workflow for triaging Results revisions efficiently, starting with reporting gaps that can trigger major revisions, then improving structure, signposting, and figure or table integration.
Try Results Section Feedback in thesify
Sign up for thesify for free, upload your draft (full manuscript or Results section only), and run Results section feedback. Use the report to identify clarity issues, figure or table integration gaps, and missing statistical reporting details before submission.

Related Posts
Improving Your Methods Section with thesify Feedback: thesify now includes methods section feedback as part of its section-level feedback for scientific papers. If you have ever received reviewer comments like “insufficient detail for replication” or “unclear sampling and analysis procedures,” you already know the pattern. Methods sections are rarely rejected because the topic is wrong, they are rejected because key methodological decisions are under-specified. Use thesify to get detailed feedback on your methods section. Learn how to document sampling, analysis and tools clearly so others can reproduce your study.
Methods, Results, and Discussion Feedback for Papers: If you are revising a scientific paper, the methods, results and discussion sections determine whether reviewers can understand, evaluate and trust your study. These sections often derail a manuscript because of missing planning, incomplete reporting or overly bold claims. This post shows what reviewers typically flag in each section and how section‑level feedback can help you catch and fix issues before submission. It draws on a recent thesify report to provide concrete examples of missing endpoints, incomplete statistics and overgeneralised interpretations. You will find checklists for each section, sample feedback themes and a revision workflow.
How to Get Table and Figure Feedback with thesify: Peer reviewers often complain about unintegrated figures, unclear captions, undefined terms and inconsistent tables. By using thesify’s rubric, you address these issues before submission. The feedback explicitly points out missing references and inadequate captions, which are common sources of reviewer dissatisfaction. Discover how thesify’s rubric provides actionable feedback on tables and figures. Learn to improve narrative integration, labeling and data integrity.