How to Get Table and Figure Feedback for Your Scientific Paper

Peer review feedback on visuals is often accurate but underspecified. When someone writes “unclear figure” or “table is not well integrated,” you still have to diagnose the cause, decide what to change, and translate that into a revision plan your co-authors can execute.
thesify helps by giving table and figure feedback at the item level. Each table and figure is checked against a small rubric, with Yes/No evaluations and concrete suggestions. The value is not a list of generic best practices, it is a way to convert ambiguous critique into tasks you can complete.

How To Get Table And Figure Feedback in thesify
This section walks you through the onboarding flow you complete after uploading a manuscript as a Scientific Paper in thesify. You will see exactly how to get feedback on tables and scientific paper figure feedback using a rubric-based workflow.
Create a new project and select “Scientific Paper.”
Upload your manuscript to start the Scientific Paper workflow.Confirm document details (author status and document type).
After upload, thesify asks you to confirm whether you are the author and to select the type of document. Choose Scientific paper to make sure Theo evaluates your manuscript using the scientific paper rubrics, including tables and figures.
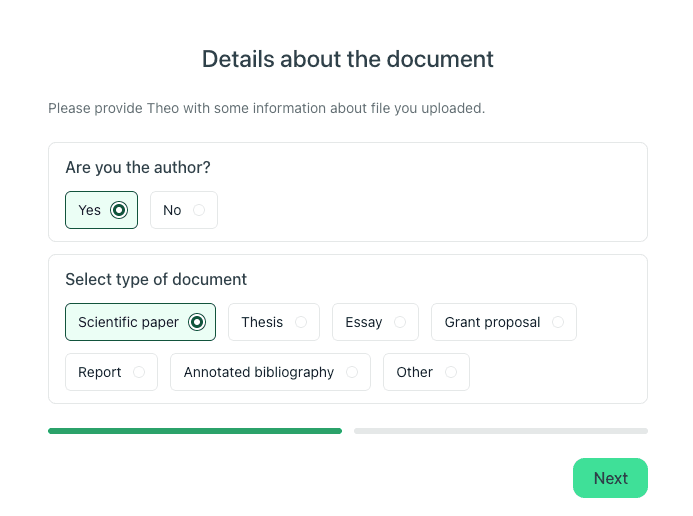
Confirm authorship and select ‘Scientific paper’ so Theo can generate rubric-based table and figure feedback for your manuscript.
Add scientific paper context (state of document and field of study).
Next, you will be asked to provide contextual information about your scientific paper:
State of document: Outline, Early Draft, Advanced Draft, Final Draft, or Submitted
Field of study: Select the closest match from the dropdown
This context matters because it helps Theo calibrate feedback across rubrics. For example, expectations around labeling, caption detail, and presentation can differ by field and by draft stage.
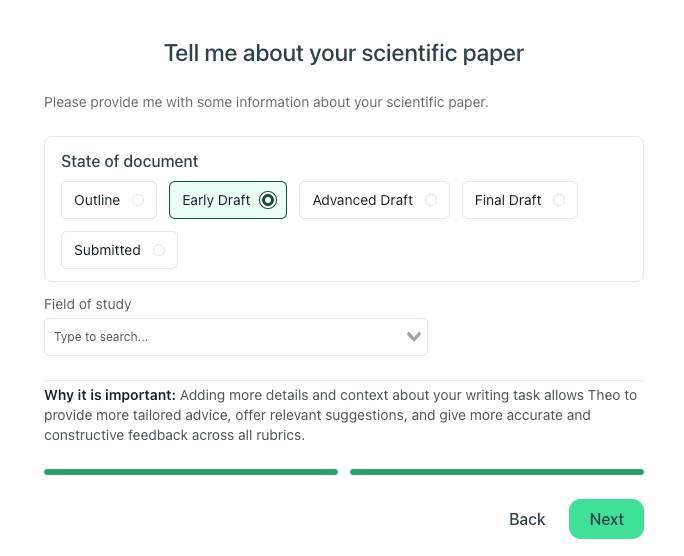
Choose your draft stage and field of study to get more targeted feedback, including clearer guidance on figure captions, labeling, and table presentation.
Open the Figures and Tables feedback section.
Once analysis completes, open Feedback, then go to Figures & Tables to review table and figure feedback per item.
In the interface, you can see the manuscript content alongside the feedback panel, so you can cross-check the figure or table while you revise.
Open Feedback, then Figures & Tables to review item-level table and figure feedback next to your manuscript.
You will typically see a short overview (for example, “What works well” and “What can be improved”), then item-level feedback that follows a rubric. For scientific paper figure feedback, this includes criteria-based checks with Yes/No evaluations and concrete suggestions you can convert into revision tasks.
Export a PDF feedback report.
When you need a shareable snapshot for revision planning, you can export a feedback report PDF. This is useful for supervision, lab review, or coordinating a round of edits, since the exported report preserves the rubric checks and the fix-list structure for each figure or table.
Export a feedback report PDF to share rubric checks and fix lists for figures and tables during revision planning.
Invite co-authors to collaborate.
If you are working with a team, you can invite co-authors to edit the manuscript project so everyone reviews the same rubric-based table and figure feedback. In the interface, the Invite Coauthors button sits in the upper-right area above the feedback panel, so it is easy to add collaborators while you are reviewing Figures & Tables feedback.
Use Invite Coauthors (top right above the feedback panel) to add collaborators to the same manuscript project and table and figure feedback.
Add co-authors by email or copy an invite link so your team can work from the same rubric-based feedback.
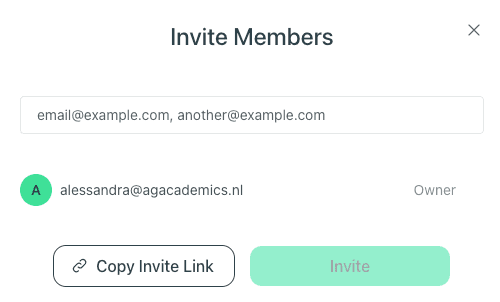
Add co-authors by email or copy an invite link so your team can work from the same rubric-based feedback.
What thesify Checks in Scientific Paper Figure Feedback
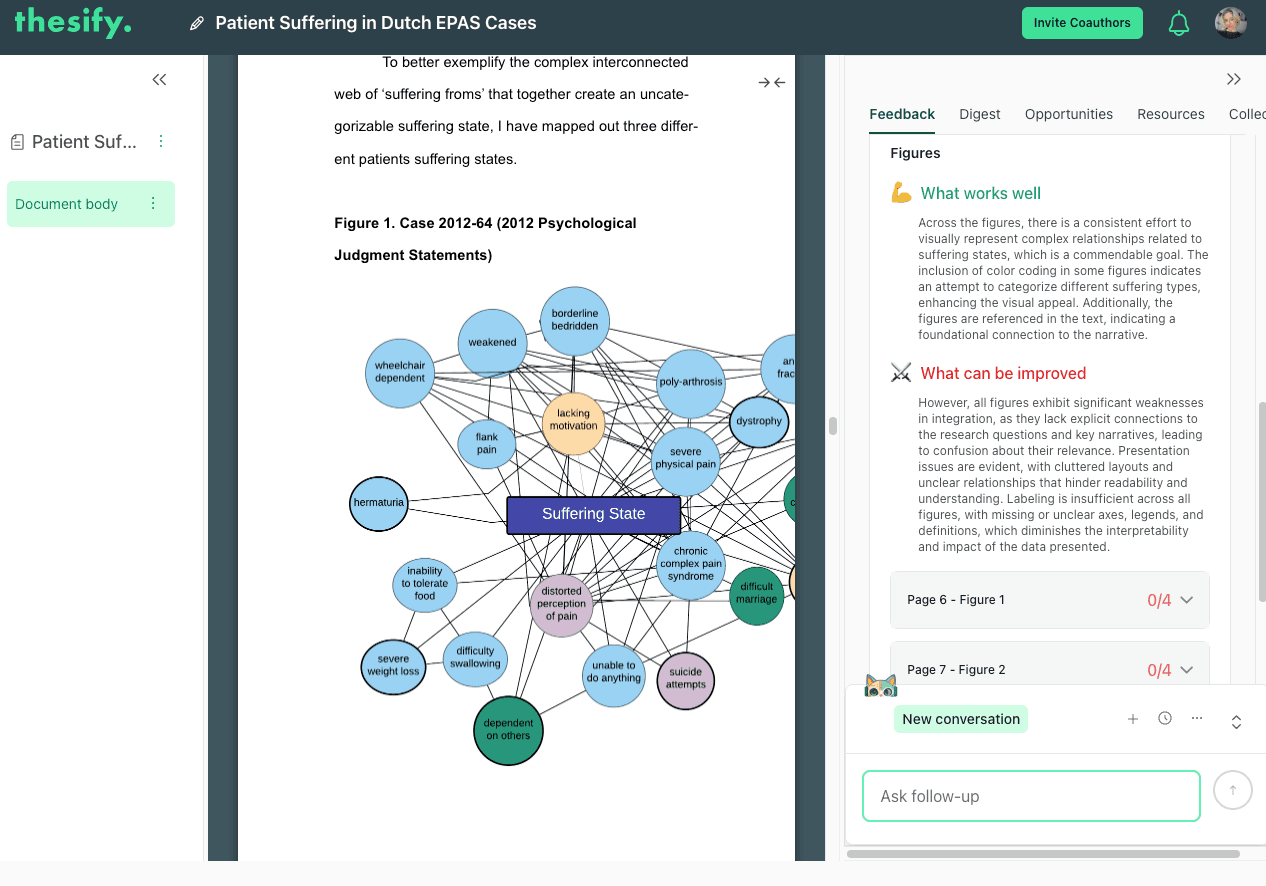
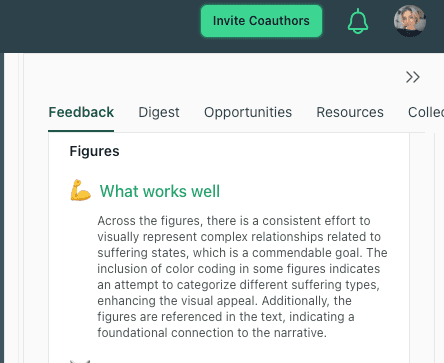
When you open Feedback → Figures & Tables → Figures, thesify starts with a cross-figure overview. You will see two blocks, What works well and What can be improved, which summarise recurring patterns across your figures.
Immediately beneath that summary, thesify lists each figure by page number with a score out of 4, so you can prioritise which figures to revise first.
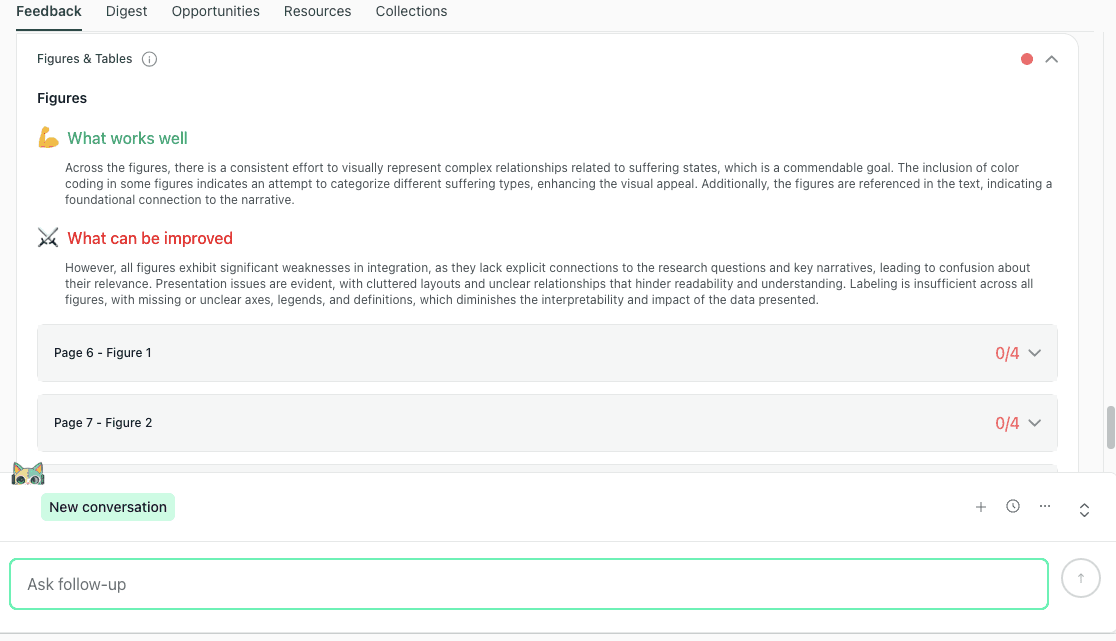
The Figures overview summarises recurring strengths and issues, then lists each figure with a score out of 4 so you can prioritise revisions.
From there, you can expand any figure in the list to view the figure preview and begin reviewing the item-level feedback for that specific figure. This side-by-side workflow is useful because you can check readability, labeling, and overall interpretability while you work through the revision actions.
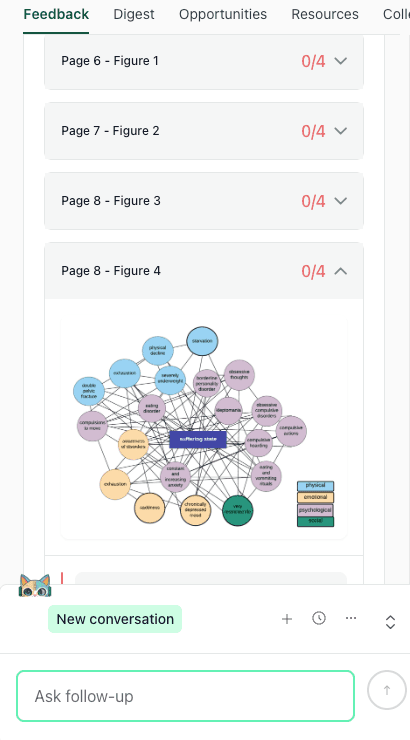
Expand a figure to view the preview and start reviewing item-level feedback while you revise captions, legends, and labeling.
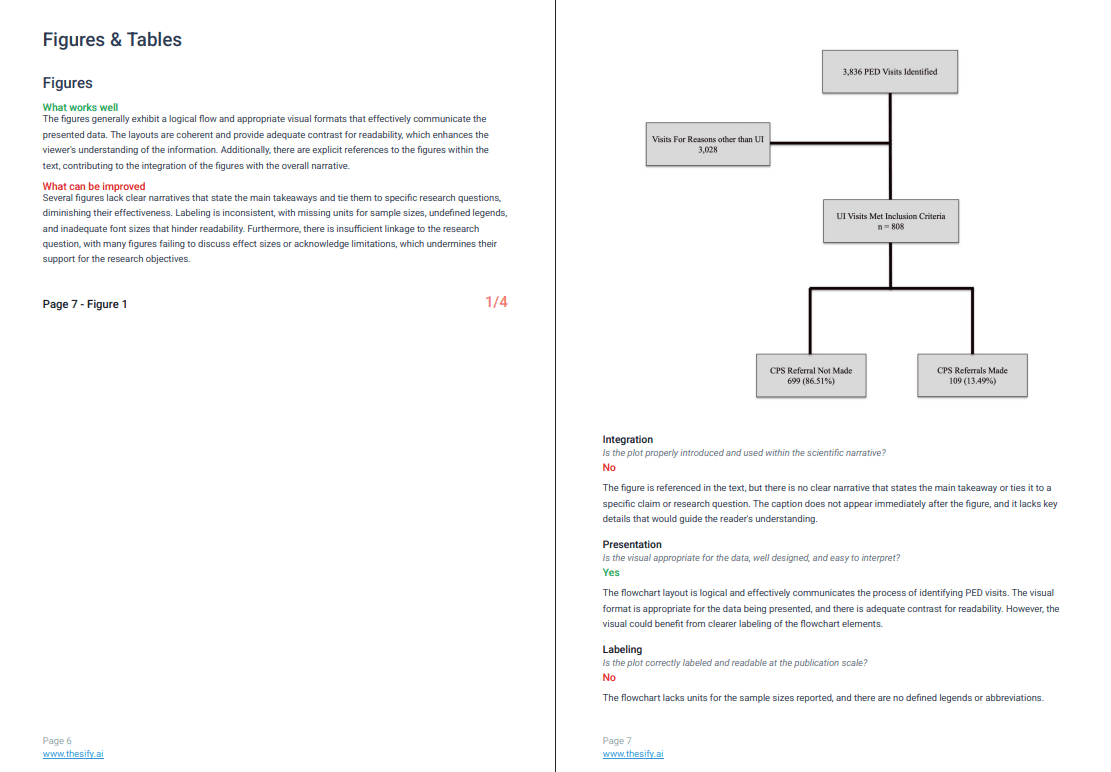
How thesify Grades Each Figure and Generates Revision Suggestions
Before you review each rubric category in detail, it helps to understand the structure of scientific paper figure feedback in thesify.
When you open an individual figure in Feedback → Figures & Tables, thesify evaluates that figure against a consistent set of rubric criteria.
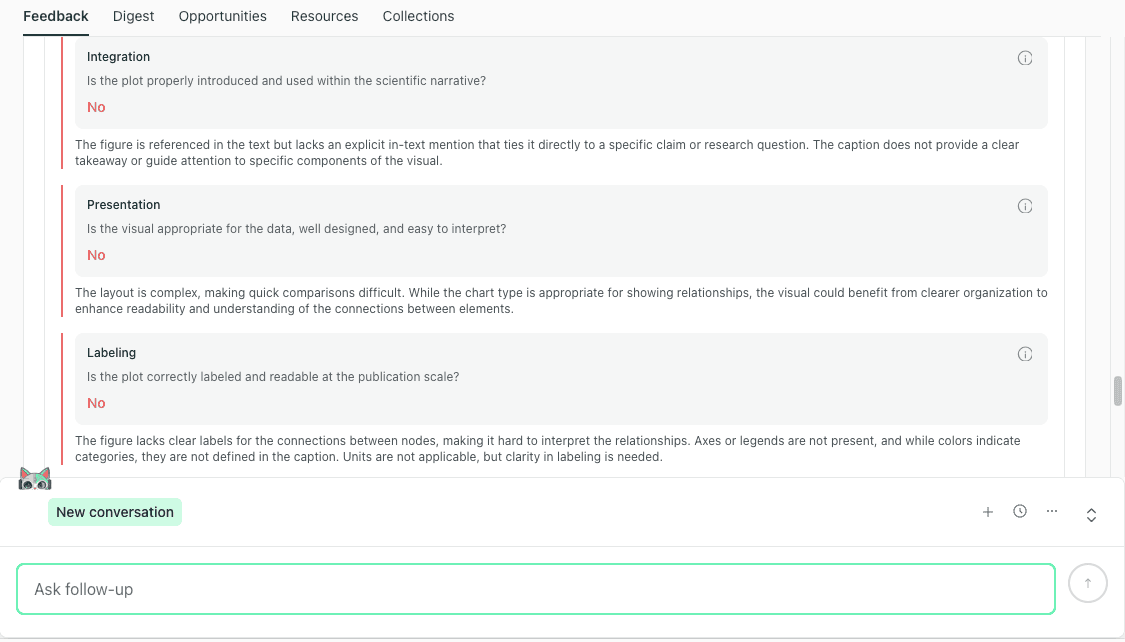
Each criterion is graded with a clear Yes/No outcome, with a short rationale explaining why the figure passed or did not pass that check. In the figure workflow, the rubric criteria are:
Integration
Presentation
Labeling
Research Question Support
After the rubric checks, thesify provides a Suggestions section for that specific figure. This is where the feedback becomes revision-ready: instead of telling you only what is wrong, it gives discrete actions you can implement, such as clarifying the caption’s purpose, improving visual cues for relationships, or linking the figure more explicitly to claims in the surrounding text.
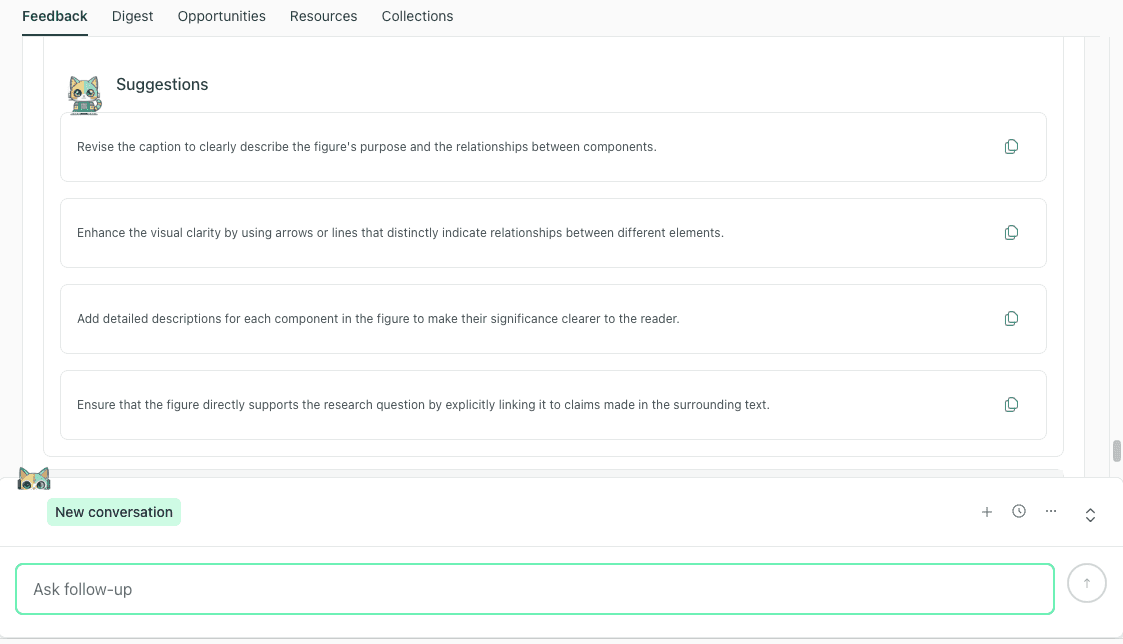
After grading a figure against rubric criteria, thesify provides a numbered suggestions list you can use as a revision checklist.
A practical way to use this output is to treat the Suggestions list as your figure revision checklist. If you are working with co-authors, it also gives you a shared, item-level task list you can assign without rewriting feedback into project-management language.
Figure Narrative Integration Feedback
What it checks: whether the figure is introduced and used in the narrative at the point where it supports a claim.
In thesify’s figures feedback, the Integration criterion is designed to catch the most common “floating figure” problem: the figure may be referenced somewhere in the text, but the narrative does not clearly explain why the figure is here or what the reader should take from it. In practice, integration issues tend to look like:
The text never points the reader to the figure at the moment the claim is made.
The text references the figure, but does not tell the reader what to notice.
The caption provides minimal context, so the figure’s role in the argument is unclear.
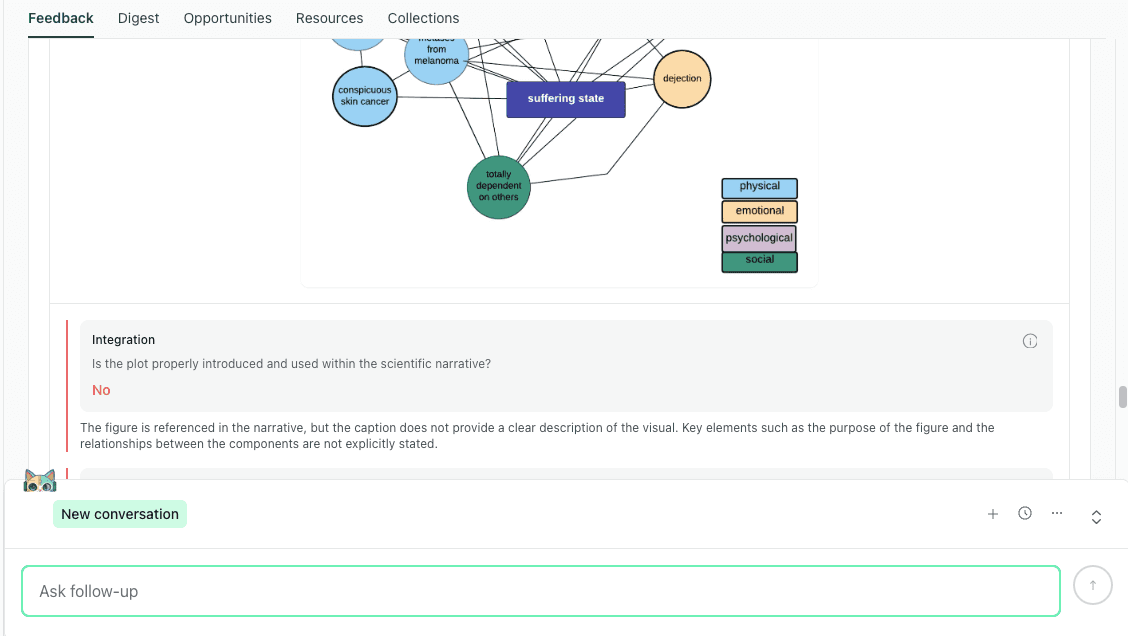
Integration feedback focuses on whether the figure is used as evidence in the narrative, with a clear callout and takeaway.
Revision moves that reliably fix integration
Add a figure callout (by number) in the paragraph where you state the result.
Add one “reading instruction” sentence that tells the reader what comparison, pattern, or relationship matters.
Revise the caption so it states the purpose of the figure and clarifies what the reader should learn from it (within journal constraints).
Figure Presentation and Readability Feedback
What it checks: whether the visual design supports quick interpretation, including layout clarity, visual hierarchy, and whether the figure remains readable at publication scale.
In the rubric, Presentation focuses on interpretability, not cosmetic formatting. It flags cases where the figure type may be appropriate, but the layout makes it hard for a reader to parse relationships quickly, especially when the figure is complex or dense. This tends to show up most often in:
dense diagrams (networks, concept maps, multi-node visuals)
multi-panel figures
figures that rely on subtle differences that disappear when resized
Presentation feedback treats layout as interpretability, helping you fix clutter and readability problems before submission.
Revision moves that improve presentation
Reduce clutter by removing elements that do not support the claim.
Simplify layout so the reading path is obvious (group related nodes, shorten crossing lines, or increase spacing).
Split one overloaded figure into panels if you need to preserve clarity at journal scale.
If labeling is also flagged in the same view, treat legend and category definitions as part of presentation, because they determine whether the figure is interpretable without rereading the full paper.
Figure Labeling, Legends, And Definitions Feedback
What it checks: whether a reader can interpret the figure without guessing, including defined abbreviations, complete legends, clear labels, and explicit units where relevant.
Labeling problems often come from perfectly normal drafting shortcuts:
an abbreviation that is defined in the text, but not in the caption
color coding used without a legend
symbols or line styles that are never explained
Revision moves that prevent “unclear figure” comments
Define abbreviations in the caption (and in-figure if the journal format allows).
Add a legend for color coding, symbols, and relationship markers.
Confirm that units and scales are explicit.
Figure Research Question Support Feedback
What it checks: whether the figure, as presented and captioned, supports a research question or a specific claim.
This criterion is useful because it forces you to make a figure’s argumentative role visible. It is also where you can lose reviewer confidence if a figure looks disconnected from the main thread.
Revision moves that connect figures to claims
Add a one-sentence takeaway in the caption (within journal constraints) stating what the figure demonstrates.
Make sure the surrounding paragraph explicitly uses the figure as evidence for the point you are making.
Structured Feedback for Complex Figures: Clutter, Legends, and Interpretability
In this section, you will learn how scientific paper figure feedback in thesify handles figures that are structurally complex, especially network-style visuals where meaning depends on relationships between many nodes.
When a figure contains many elements, reviewers often default to vague reactions like “too busy,” “hard to follow,” or “unclear what this shows.” The value of rubric-based feedback is that it breaks those reactions into specific checks you can revise against. In the downloadable feedback report, you can see the same complex figure evaluated across the core figure criteria (Integration, Presentation, Labeling, and Research Question Support), with a clear pass or fail signal for each item and an explanation of what is making the figure difficult to interpret.
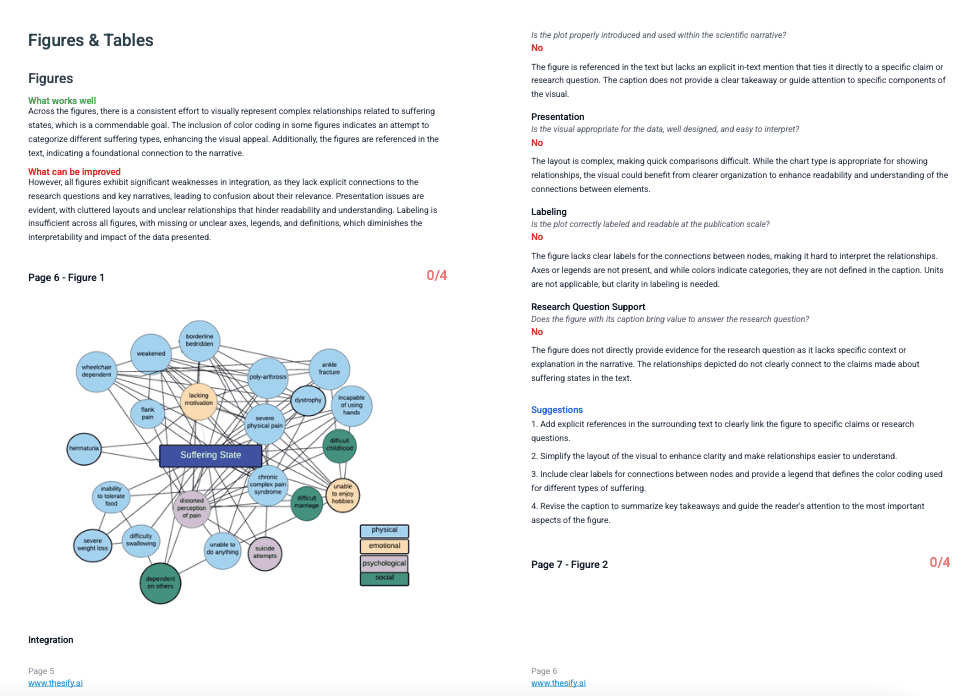
In the downloadable feedback report, complex figures are graded against rubric criteria and paired with concrete suggestions to improve clutter, legends, and interpretability.
For complex figures, the highest-yield revision moves tend to cluster into three areas:
Clarify legends and category definitions. If the figure relies on color coding, line styles, or relationship types, the reader needs those definitions on the page, usually in the caption or legend, so interpretation does not depend on reading the full paper twice.
Reduce clutter to restore a readable structure. Dense figures often become hard to parse because there is no visual hierarchy. Simplifying elements, spacing nodes more clearly, and limiting the number of simultaneous relationship cues can make the figure interpretable at journal scale.
Make the reading path obvious. A figure can contain valid information but still fail if the reader cannot tell where to start and what to compare. Small layout changes (grouping, clearer connections, or visual cues that guide attention) can shift a figure from “interesting but confusing” to “usable as evidence.”
A practical way to use this feedback is to treat it as a revision checklist for one figure at a time: revise the caption and legend first, then simplify layout for readability, then confirm that the surrounding text explicitly tells the reader what claim the figure supports.
Table Feedback for Research Papers: Integration, Presentation, and Data Integrity
This section shows you where to find table feedback in thesify and how to use it to improve tables in research papers before submission.
After you review the Figures feedback in Feedback → Figures & Tables, scroll to the Tables area. You will see a short cross-table overview that summarizes patterns across your manuscript, using What works well and What can be improved.
This overview is useful for quickly spotting whether your main table issues are narrative (tables not clearly used in the text), presentation (hard to scan or compare), or data consistency (denominators, missing data, totals, or statistical formatting).
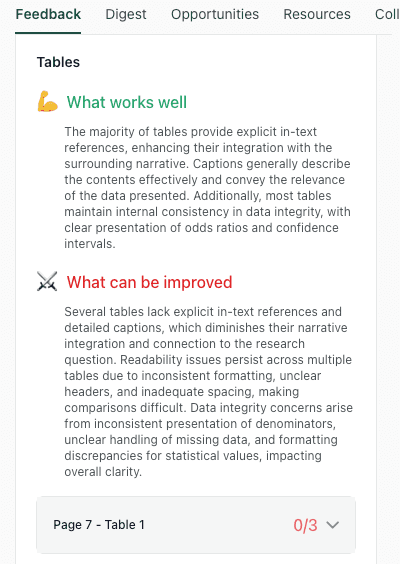
The Tables overview summarises recurring table issues across integration, presentation, and data integrity before you review each table.
Below the overview, thesify lists each table by page number, with a score out of 3. This lets you prioritise your revisions, starting with the tables that need the most work.
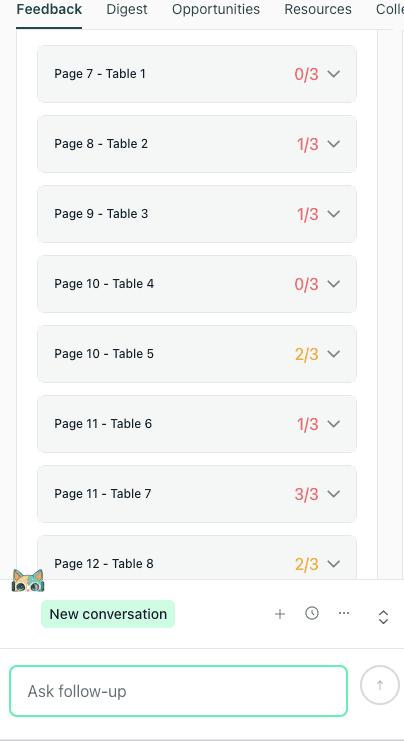
Each table is listed by page number with a score out of 3, helping you prioritise which tables to revise first.
When you expand an individual table, you will see the table preview alongside the rubric checks. Each table is assessed against three criteria, each graded Yes/No with a short rationale:
Narrative Integration
Presentation
Data Integrity
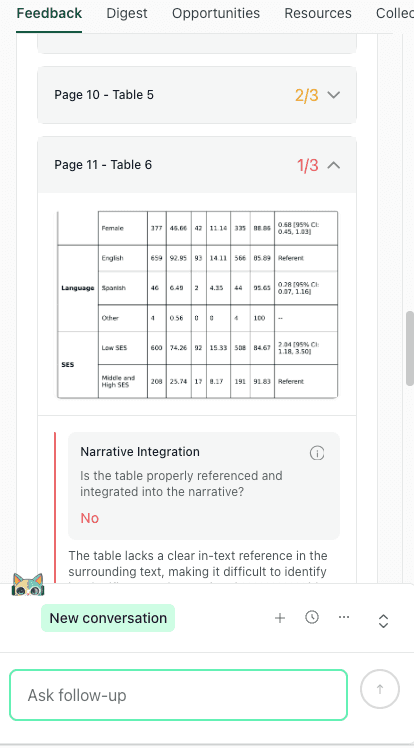
Expand a table to view the preview and rubric checks for narrative integration, presentation, and data integrity, followed by revision suggestions..
After the rubric checks, thesify provides table-specific Suggestions that break fixes into discrete actions you can apply during revision (for example, clarifying the caption, improving headers, or making denominators and missing-data handling explicit).
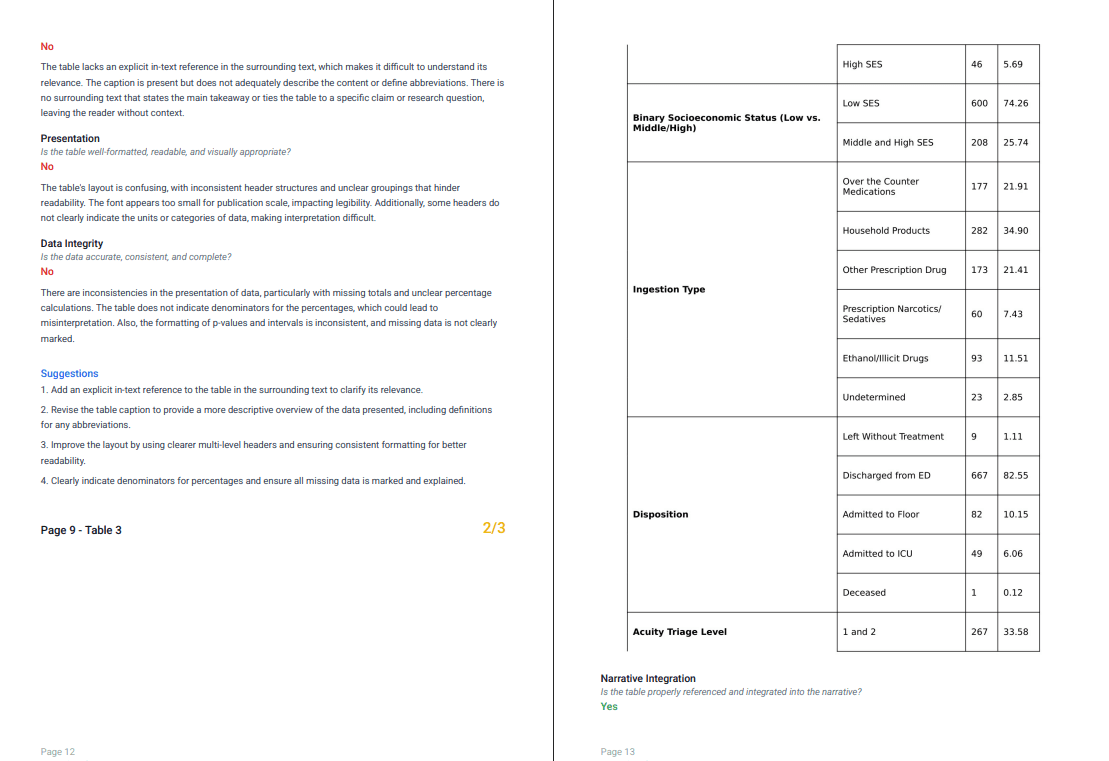
The exported report preserves the rubric checks and fix list structure for each table, which is useful for revision planning and collaboration.
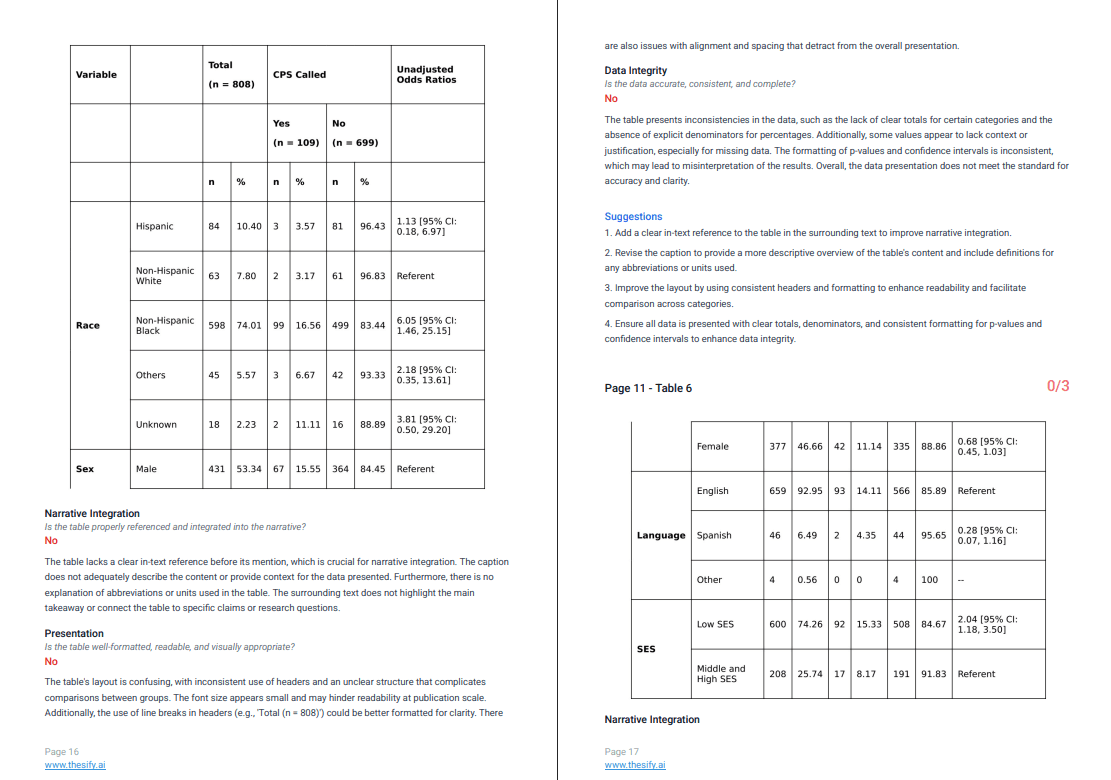
Table Narrative Integration Feedback
What it checks: whether the table is explicitly referenced where it is used, and whether the narrative guides the reader to what matters in the table.
In thesify, Narrative Integration is designed to catch the “floating table” problem. A table can be present and technically correct, but still fail as evidence if the surrounding text does not tell the reader why it is included or what to look at.
In the rubric view, Narrative Integration is graded Yes/No, followed by a short rationale that explains what is missing (often an in-text callout, a clear takeaway, or caption context).
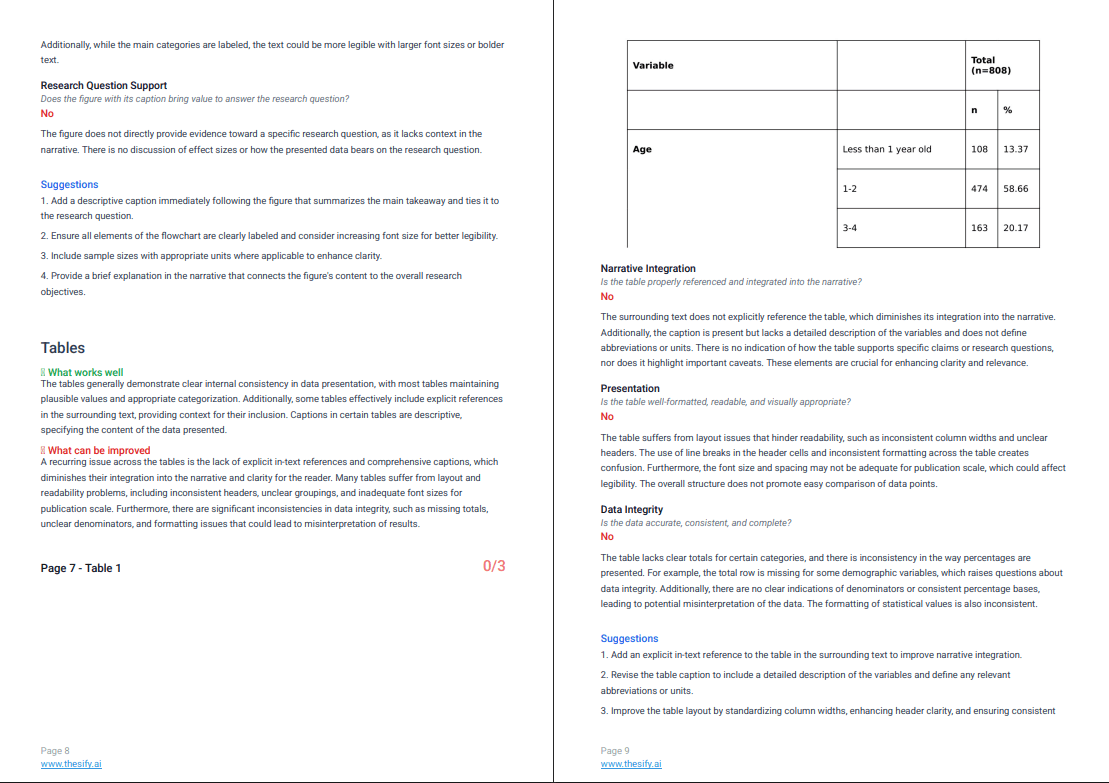
Narrative integration feedback shows whether the table is clearly referenced in the text and whether the caption and surrounding narrative guide the reader to what matters.
Integration issues are usually one of these:
The table is present, but never called out in the text.
The text mentions the table, but does not point to the key row, column, or comparison.
The caption does not tell the reader what the table is meant to show, so the table’s role in the argument is unclear.
Revision moves that fix the floating table problem
Add a table callout by number in the paragraph where the result is stated.
Add one sentence that points the reader to the key comparison (for example, Table 2 shows X, or In Table 3, note the difference between A and B).
Make the caption interpretive, not only descriptive, so the reader understands what the table is doing in the argument (within journal constraints).
Table Presentation And Formatting Feedback
What it checks: whether the table structure supports scanning and comparison, including header hierarchy, grouping, spacing, and legibility.
This is where table formatting stops being cosmetic. If a reader cannot scan the table quickly, they will not trust it, and they may not use it as evidence.
Revision moves that improve table readability
Rebuild multi-level headers so hierarchy is clear.
Group variables logically (by concept, population, timepoint, outcome).
Standardise conventions across tables (decimal places, confidence interval format, unit placement).
Table Data Integrity Checks
What it checks: whether the table signals accuracy and completeness, including denominators for percentages, consistent totals, clear missing-data notation, and consistent statistical formatting.
In thesify, Data Integrity is where table feedback becomes especially revision-ready. This rubric criterion targets the issues that tend to trigger fast “this seems unreliable” reactions in peer review, even when your underlying analysis is sound.
The check focuses on whether the table itself provides the information a reader needs to interpret values correctly, without guessing what a percentage is based on, whether totals are complete, or how missing data were handled.
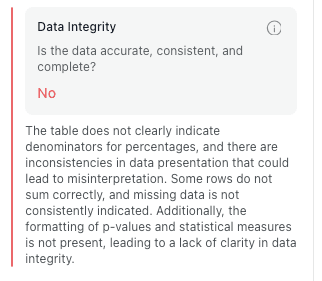
Data integrity feedback highlights denominators, totals, missing data, and statistical formatting issues that reviewers often interpret as reliability problems.
Revision moves that improve data integrity
Include denominators wherever you report percentages.
Standardise missing-data notation and footnotes so readers can tell what is missing and why.
Audit totals and rounding conventions across related rows and columns.
Standardise statistical presentation across tables (p-values, confidence intervals, odds ratios), so formatting does not change from one table to the next.
A Strong Table Example: What “Yes/Yes/Yes” Looks Like
In this section, you will learn how table feedback for research papers in thesify can also confirm when a table is already meeting baseline expectations. This matters because a rubric is only useful if it can distinguish between “needs work” and “largely ready,” using the same criteria across all tables.
When a table performs well, thesify still evaluates it against the same three rubric categories:
Narrative Integration (is the table clearly referenced and used in the surrounding text?)
Presentation (is the table readable and formatted for publication scale?)
Data Integrity (is the data consistent, interpretable, and complete on the page?)
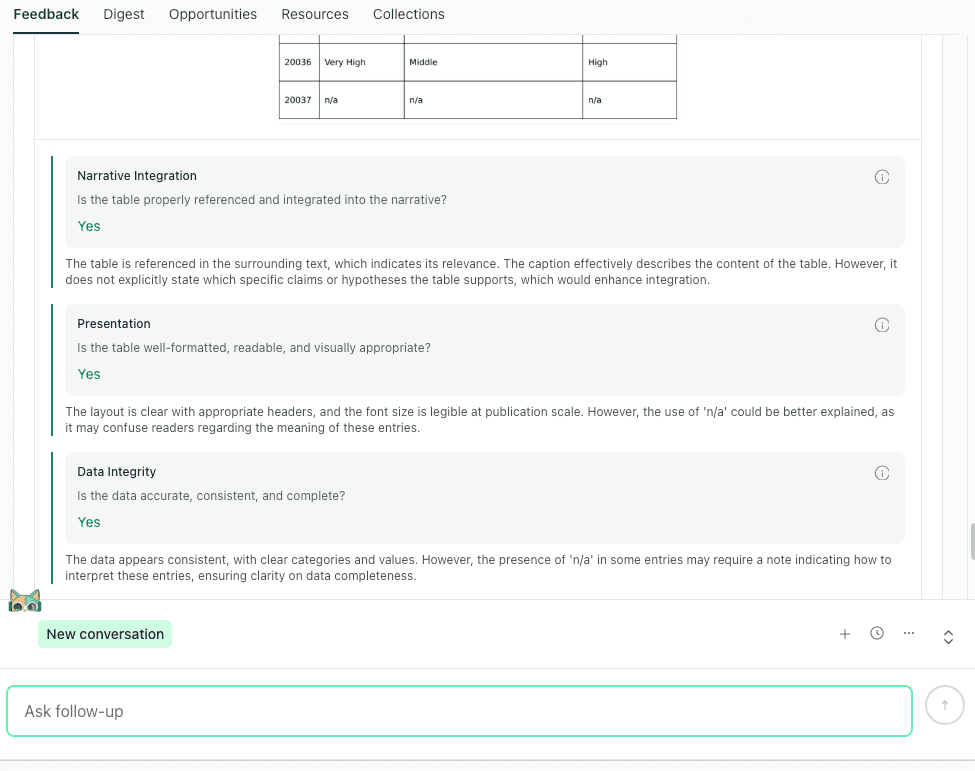
A strong table can score Yes for narrative integration, presentation, and data integrity in thesify, with only minor clarity improvements suggested.
In the interface, a strong table will show Yes across these checks, with brief notes that focus on small refinements rather than structural problems. This is useful when you are coordinating revisions with co-authors, because it creates a shared standard: you can treat “Yes/Yes/Yes” as a signal to leave the table mostly intact, then apply only the minor clarifications needed for reader comprehension (for example, defining ambiguous notations or adding a short interpretive cue in the caption).
Table and Figure Checklist for Revising Before Submission
This section gives you a table figure checklist aligned with the rubric, so you can revise efficiently and consistently.
Checklist for Figures in Research Papers
Integration
Is the figure called out in the paragraph where the claim is made?
Does the text tell the reader what to notice?
Caption
Does the caption state what the figure demonstrates?
Are key constraints or caveats stated (sample definition, exclusions, conditions)?
Labeling
Are abbreviations defined in the caption?
Are units, scales, and legends complete?
Readability
Will it remain interpretable when resized in a two-column PDF?
Is the main comparison visually obvious?
Checklist for Tables in Research Papers
Integration
Is the table called out by number where the result is stated?
Does the text point to the relevant row, column, or subgroup?
Formatting
Are multi-level headers clear and logically grouped?
Is spacing sufficient for scanning?
Data Consistency
Are denominators present for percentages?
Do totals align (including rounding)?
Is missing data indicated consistently?
Are statistical formats consistent across tables?
Export Feedback Report PDF and Invite Co-Authors to Edit Manuscript
This section explains how to keep table and figure feedback usable across a team, especially when different co-authors own different visuals or when you are planning a structured revision round.
Export a PDF feedback report for revision planning
Once you have reviewed Figures & Tables feedback, you can export a feedback report PDF to create a shareable snapshot of what was flagged and what to fix next. The export format preserves the rubric structure per item (per table, per figure), including the Yes/No checks and the suggestions list, which makes it easier to coordinate revisions without rewriting feedback into a separate document.
Exporting a feedback report PDF preserves rubric checks and suggestions, making table and figure revisions easier to coordinate with co-authors.
Exporting is especially useful when you want to:
Assign fixes by table and figure number so co-authors can work in parallel without overlap
Keep a record of what was flagged and what was changed across revision rounds
Align on shared criteria (integration, presentation, labeling, data integrity), rather than debating formatting preferences without a standard
Invite co-authors so everyone works from the same rubric
If you are collaborating, inviting co-authors to the manuscript project helps keep table and figure revisions coordinated. Instead of circulating screenshots, copy-pasting comments into email threads, or duplicating feedback across drafts, collaborators can review the same item-level rubric checks and apply fixes directly against the same set of criteria.
A practical workflow is to export the PDF for a quick overview (for a lab meeting, supervisor review, or revision plan), then use the in-app project view to assign who will revise which figure or table and confirm changes against the rubric.
FAQ: Manuscript Tables and Figures Guidelines
How Do I Improve Tables and Figures Before Journal Submission?
Start by checking whether each table and figure is doing a clear job in your argument. In practice, that means (1) the text calls it out where the relevant claim is made, (2) the caption tells the reader what to notice, and (3) the visual is readable at publication scale.
In thesify, you can run this as a repeatable workflow by uploading your manuscript as a “Scientific Paper”, then reviewing each item in Feedback → Figures & Tables against the rubric checks and suggestions.
What Do Peer Reviewers Look For in Tables and Figures?
Reviewers usually assess the same core issues, even if they describe them informally. They look for integration (does the visual support a specific claim in the text), interpretability (can the reader understand it quickly without hunting for definitions), and presentation quality (is it readable after resizing). For tables, reviewers also scrutinize data integrity signals, such as denominators, totals, missing-data handling, and consistent statistical formatting, because these affect trust.
What Is Narrative Integration for Tables and Figures?
Narrative integration means the visual is used as evidence at the right moment in the paper. The reader should see a callout (Table X or Figure Y) in the paragraph where the claim is stated, plus one sentence that tells them what pattern, comparison, or relationship matters. If the visual is referenced only generally, or the caption is purely descriptive, it often reads like an output that is present but not doing argumentative work.
How Do I Fix Data Integrity Problems in Tables?
Most data integrity issues are small but high impact. Add denominators for percentages, standardize how missing data are shown (and explain it in a footnote), check that totals and rounding conventions are consistent, and format statistics the same way across tables (p-values, confidence intervals, odds ratios). If you treat these as a checklist per table, you reduce the risk of reviewer concerns about reliability that stem from presentation rather than analysis.
What Should a Caption Include for a Figure?
A strong caption defines abbreviations and legends, then states what the figure shows. If the figure is dense, add one sentence telling the reader how to read it.
How Do I Connect a Table to the Narrative of a Scientific Paper?
Reference the table by number in the paragraph where you state the result, then point the reader to the row or comparison that matters.
Are There Tools That Give Feedback on Tables and Figures?
Yes. A rubric-based approach is useful because it breaks “unclear” into specific categories, which makes revision planning faster and more consistent.
Can I Export Feedback on My Manuscript for Co-Authors?
Yes. Exporting a report supports coordination when table and figure fixes are distributed across collaborators.
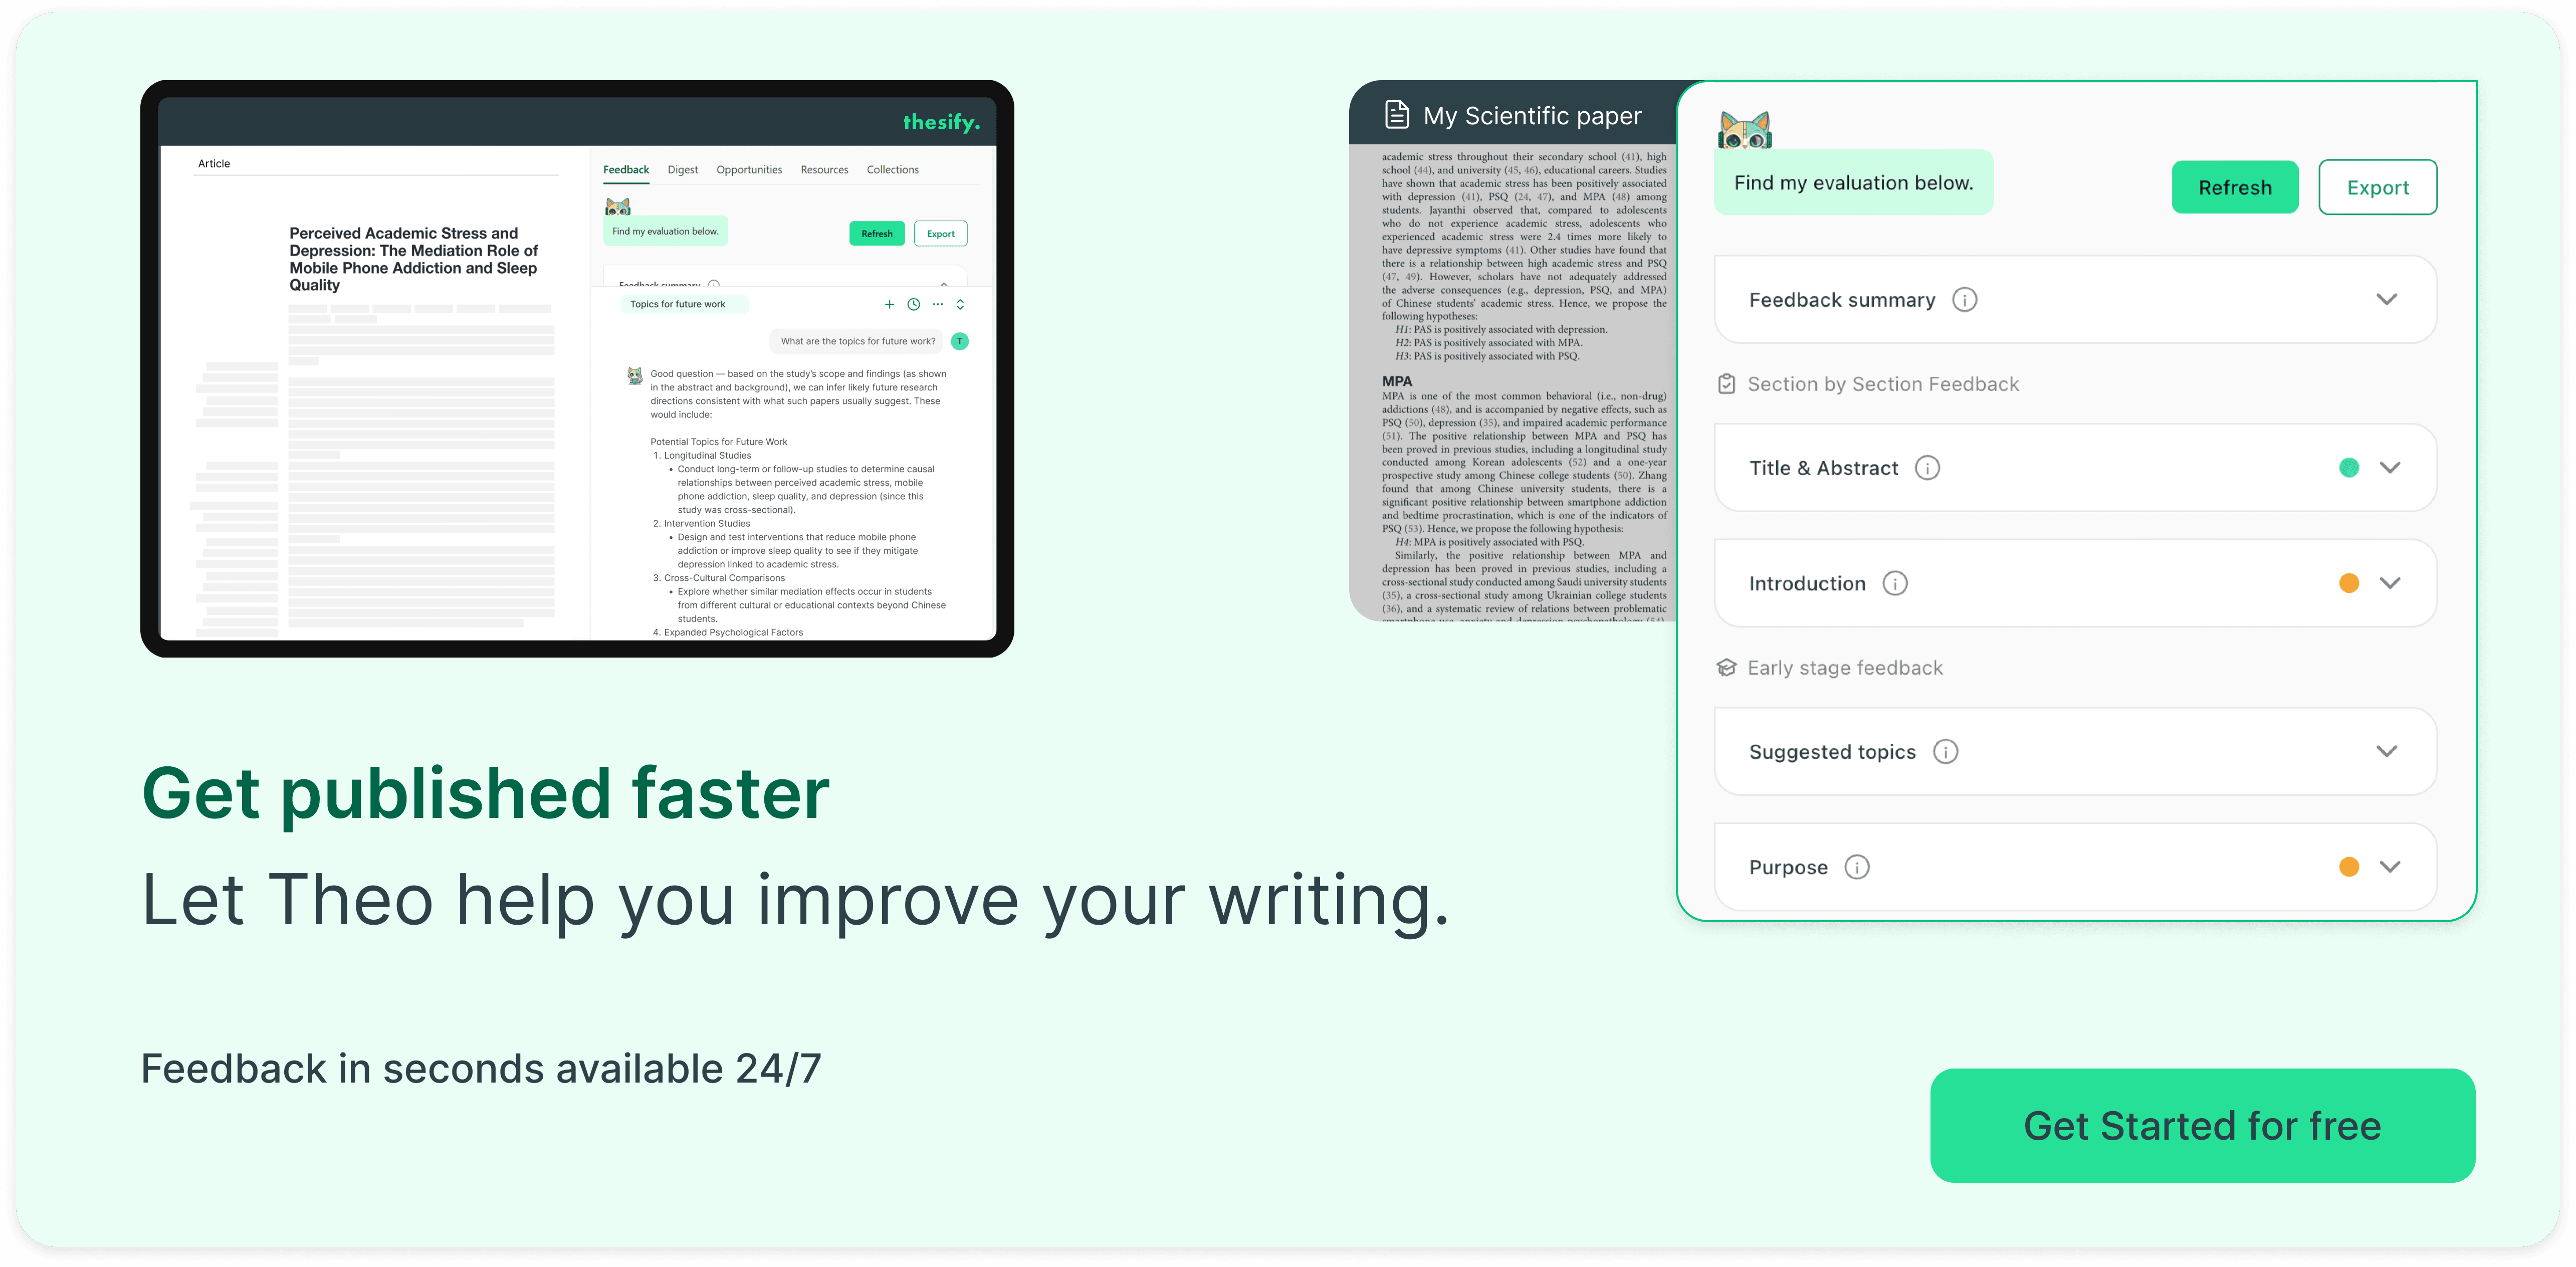
Sign Up for Free to Get Table and Figure Feedback in thesify
If you want a repeatable workflow for table and figure feedback before submission, you can sign up for thesify for free, upload your manuscript as a Scientific Paper, review each table and figure against the rubric, export a report, and invite co-authors to collaborate on revisions.
Related Posts
How to Use thesify’s Downloadable Feedback Report for Pre‑Submission Success: thesify’s downloadable feedback report provides organised summaries, rubric‑based evaluations and actionable recommendations you can keep beside your draft while revising. By integrating AI feedback thoughtfully, you not only improve your writing but also contribute to a culture of openness and rigour in academic research. In article you’ll learn what a pre‑submission assessment report looks like, how thesify’s report stands out, and how you can generate and use your own downloadable report.
What Authors Need to Know About Pre-Submission Review vs Peer Review: When you start preparing a manuscript or grant proposal, it’s easy to conflate every bit of feedback with “peer review.” Yet these terms refer to very different stages of the publication pipeline. A clear grasp of when and why to seek each type of review can save you months of work and prevent wasted submissions. Learn the differences between pre‑submission review and journal peer review, when to use each, and where AI tools like thesify fit into your publishing workflow.
Chat with Theo: A New Way to Turn Feedback into Revision: You’ve received feedback on your draft—now what? Meet ‘chat with Theo,’ thesify’s new feature that lets you converse with an AI about your own paper, feedback report, and more. This guide explains how to use Theo for structured revision while preserving academic integrity. Unlike other AI to check my essay or AI chat with document tools, Theo helps you improve your work, not writes it for you. Learn how to use AI to revise an essay ethically with Chat With Theo and get a full revision workflow that demonstrates ethical AI use in depth.